Key Findings
INTRO
Understanding Key Aspects of Black History Month Programming
The online questionnaire was launched during ALA Mid-Winter Conference in 2021 and was disseminated widely on various listservs. Two hundred seventy-nine people completed the survey; 164 librarians from local branches and 115 librarians from District/County System libraries.
While the respondents were not chosen systematically, these results are important because this was the first attempt to assess BHM programming in public libraries. The findings should be considered preliminary until a representative national survey can be conducted. The results from the entire study are forthcoming in the final project report.
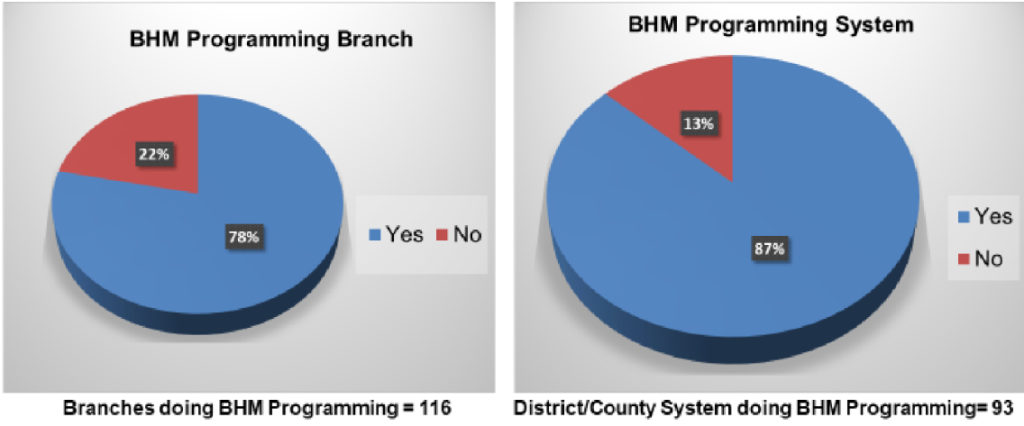
Percentage of Libraries Conducting BHM Programming
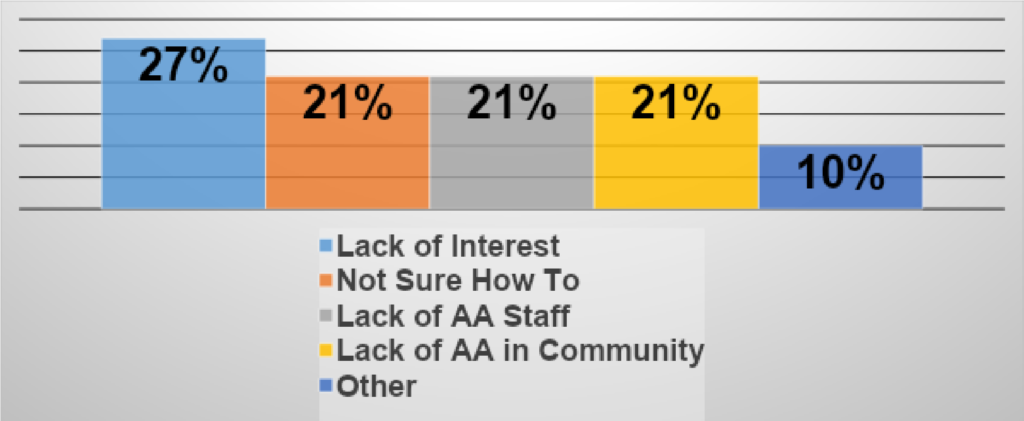
Why No BHM Programming?
Branches and District Systems differed somewhat in their responses as to why they did not do BHM programming. For Branches, they reported not being sure how to do such programming as the most important reason (25%), followed closely by “lack of interest” and “other reasons.” District/County System libraries cited “lack of interest” (27%), followed by not being sure, lack of African Americans to create the program, and lack of African Americans in the community (all 21%).
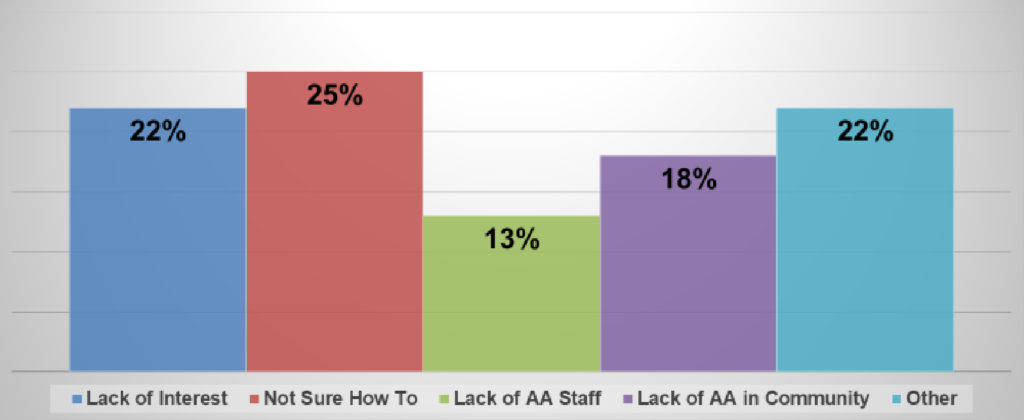
Of the 22% in local branch libraries who cited “Other Reasons”, some of those included:Of the 22% in local branch libraries who cited “Other Reasons”, some of those included:
“We are a very small, rural library, and I am the only full-time librarian, so it is hard to create programs for every topic.”
“White supremacist mindset of library administration.”
“Our BHM programming has mostly been limited to book displays.”
“We used to do Black History Programs, then the library’s administration changed. The new administration, along with some staff, felt the library should only do programming that includes everybody (i.e. stuff that won’t offend and/or scare white people Anglo/Euro-centric programs).”
BHM Programming Focused on Different Historic Periods
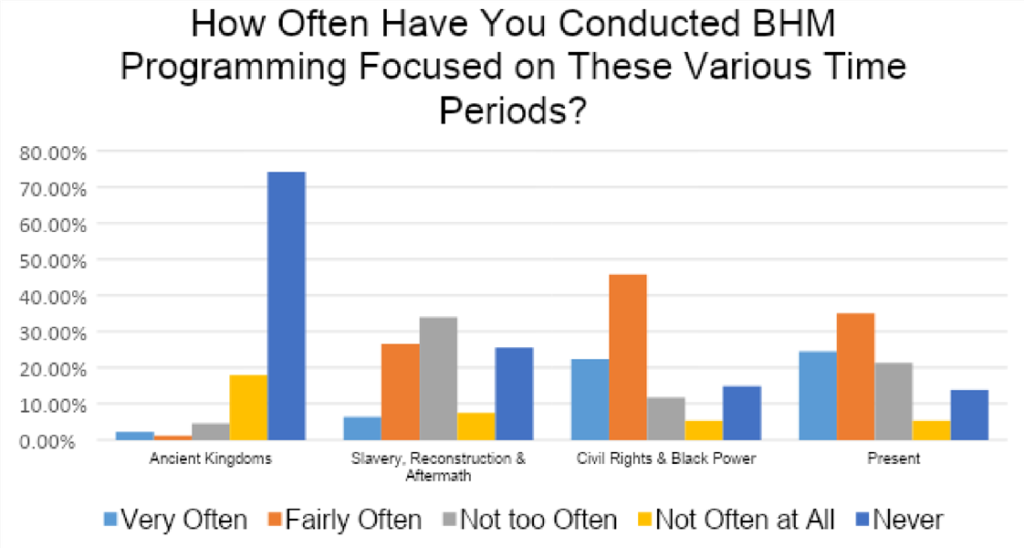
Respondents were asked, “How often have you conducted BHM programming focused on these various time periods?”
-Ancient Kingdoms (Prior to 1619)
-Slavery, Reconstruction & Aftermath (1619-1949)
-Civil Rights & Black Power (1950-1970)
-Present Day (1970 –present)
For each period, they were asked to indicate whether they did programming Very Often, Fairly Often, Not Too Often, Not Often at All, or Never in that category.
While at the local branch level, 69% of the BHM programming was done Very Often or Fairly Often, but 60% of the programming at that frequency focused on the Present. What is most striking is that 74% of the BHM programming “Never” focused on Africa and Ancient African Kingdoms; that is, history before to the arrival of the first enslaved African Americans. This is highly problematic because it means the history of Black people in this country begins with slavery and not the important history before that.
Percentage of African American History Programming During February
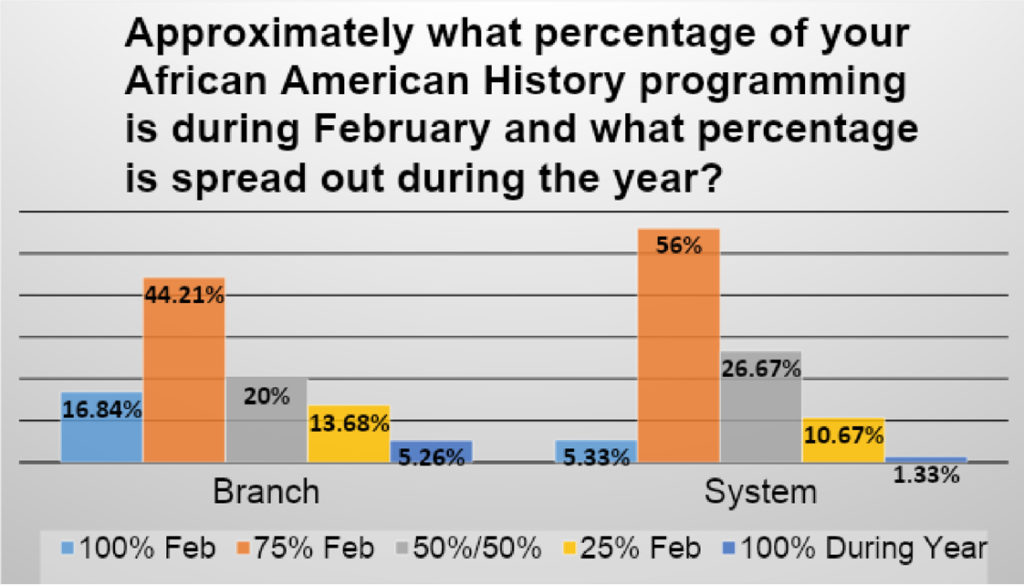
There has been considerable debate at the end of the 20th century and the beginning of the 21st century whether African American history should be shared primarily or exclusively during Black History Month, or whether it should be incorporated into programming throughout the year. We asked respondents, “Approximately what percentage of your African American history programming is during February and what percentage is spread out during the year?” The response categories were:
- 100% during February
- 75% during February and 25% during the year
- 50% during February and 50% during the year
- 25% during February and 75% during the year
- 100% during the year
While both local branches and District/County System libraries conducted 75% of their African American history programming in February, the System did so to a greater extent; 56% vs. 42%. Interestingly, when you combine the first two response categories, both Branches and Systems do 61% either all or most of their programming in February.
Knowledge of Black History Month Theme
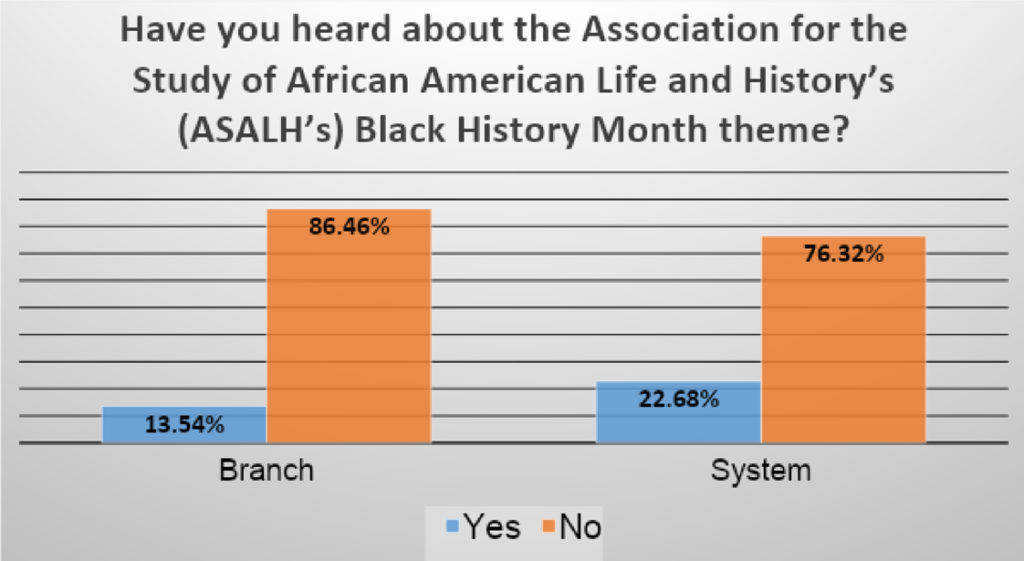
This key finding ties directly to the literature review and history of Black History Month. We asked respondents:
“Have you heard about the Association for the Study of African American Life and History’s (ASALH’s) Black History Month theme?”
The overwhelming majority of librarians at the Local Branch (86%) and District/System (76%) had not heard of ASALH’s Black History Month theme. While it is good that most public libraries conduct BHM programming, it is not necessarily tied to the annual theme. ASALH is an essential resource for BHM programming. More information about the organization and annual BHM theme can be found under Resources on this website.
Next Steps
We have more data from the online survey undertaken for this IMLS Planning Grant. That data will be analyzed, but as mentioned before, since it is based on a convenience sample (people who heard about the survey and were interested completed the questionnaire), the findings should be considered preliminary. A national survey conducted on a representative sample of librarians needs to be conducted to have complete confidence in the results.